Glycogen
storage diseases are the result of deficiency of enzymes that cause the
alteration of glycogen metabolism. The liver forms (type I, III, IV and VI) are
marked by hepatomegaly due to increased liver glycogen and hypoglycemia caused
by inability to convert glycogen to glucose. The muscle forms (type II, IIIA, V
and VII) have mild symptoms appearing during sternous exercise owing to
inability to provide energy for muscle contraction.

This blog is useful for all who is concerned with Biochemistry.
Monday, November 19, 2012
INBORN ERROR OF CARBOHYDRATE METABOLISM
Deficiency or absence of an enzyme that participate in carbohydrate metabolism may result in accumulation of monosaccharides, which can be measured in urine. Most of these conditions are inherited as autosomal recessive traits.
DISORDER OF GALACATOSE METABOLISM
Galactose is derived from milk in diet. It is the C4 epimer of glucose. A deficiency of any of the enzyme that participates in conversion of galactose to glucose results in galactosemia. Galactosemia occurs due to inhibition of glycogenolysis.
GALACTOSE-1-PHOSPHATE URIDYL TRANSFERASE DEFICIENCY
Infants with this deficiency fail to thrive on milk because half of the milk sugar, lactose is galactose. Within few days of milk ingestion neonates manifest vomiting and diarrhea. Failure to thrive, liver disease, cataracts and mental retardation develop later. This disorder is identified by measuring erythrocyte galactose -1-phosphate uridyltransferase activity.
GALACTOKINASE DEFICIENCY
This is milder condition manifested by cataracts caused by galactitol deposits in the lens. The diagnosis is confirmed by demonstrating normal transferase activity no galactokinase in red blood cells.
DISORDER OF FRUCTOSE METABOLISM
Fructose may appear in the urine after eating fruits, honey, and syrups, but has no significance in these conditions. Three disorders of fructose metabolism inherited as autosomal recessive trait produces fructosuria.
Essential fructosuria
This occurs due to deficiency of fructokinase
Hereditary fructose intolerance
A deficiency of fructose-1-phosphate aldolase produces this disorder with hypoglycemia and liver failure. Fructose ingestion inhibits glycogenolysis and gluconeogenesis, producing hypoglycemia.
Hereditary fructose-1, 6-diphosphate deficiency
DISORDER OF PENTOSE METABOLISM
Alimentary pentosuria
Pentose may be present in the urine after eating large quantities of fruits such as cherries, plums, or prunes.
Essential pentosuria
This is harmless inborn error caused by deficiency of L-xylulose reductase an enzyme involved in the glucuronic acid pathway.
Individual sugars can be measured by qualitative tests and chromatography
Emergency treatment of hypoglycemia
Glucose
should be administered orally (10-20 g in adult patient, 3 times before giving
a meal). If oral therapy is not possible the parenteral dose of glucose for
adult should be 25-50g as 50-100 mL of 50% dextrose should be given. Failure to
respond to glucose, glucagon should be administered intramuscularly or
intravenously, steroids (hydrocortisone).
Causes of hypoglycemia:
1. Medical therapy of diabetes especially
insulin administration or oral hypoglycemia drug is the most common cause of
fasting hypoglycaemia.
2. Surreptitious (self-induced) administration
of hypoglycemic agents (factitious or felonious hypoglycaemia) like insulin,
sulphonylureas, metiglinides, etc.
3. Insulinoma: Insulin producing islet
cell tumors.
4. Autoimmune hypoglycemia
In one
condition antibodies binds to insulin receptors and mimic the action of
insulin. Laboratory finding shows high plasma insulin concentrations but
suppressed C-peptide and proinsulin. The other syndrome, autoimmune insulin
syndrome, in which antibodies are direction towards insulin. Laboratory finding
shows high plasma concentration of insulin and C-peptide (C-peptide level is
quiet less than insulin).
1. Hypoglycaemia associated with renal
failure:
Renal
impairment leading to hypoglycaemia is the second most common cause of
hypoglycaemia, after insulin therapy. The most important factor here is calorie
restriction. In normal subjects, the kidney, by gluconeogenesis supply 45% of
glucose during prolonged starvation. In uraemic patient this process is
impaired. Other mechanisms include increase insulin half-life due to impaired
renal clearance and degradation.
2. Hypoglycemia associated with liver
disease:
Liver can
maintain glucose homeostasis even functioning liver mass reduces to <20% and
hypoglycemia does not occur unless liver is extensively damaged. Conditions
like fatty liver, cirrhosis, infective hepatitis, hepatocellular carcinoma are
associated with hypoglycaemia.
3. Alcohol induced hypoglycaemia:
Alcohol
induced fasting hypoglycemia is due to direction inhibition of gluconeogenesis.
This is due to accumulation of NADH and increased NADH/NAD+ ratio
resulting from the oxidation of ethanol. Alcohol induced fasting hypoglycemia
usually develops 6-36h after ingestion of alcohol. There is severe metabolic
acidosis with high blood lactate. Hyperketonaemia and ketonuria are present
predominantly β-OHB, since the accumulation of NADH suppress the conversion of
it to acetoacetate. Prompt IV glucose treatment should be done.
Alcohol
potentiates the hypoglycemic effect of insulin and sulphonylurea drugs. Alcohol
potentiates the insulin-stimulating effect of glucose and thus increase the
risk of reactive hypoglycemia. This is seen during consumption of alcohol and
sucrose (e.g. in syrup or tonic) in empty stomach and followed by not eating
for few hours afterward. This effect is not seen when saccharin or fructose is
substituted for sucrose as sweetening agent. Starchy foods like breads increase
the risk fro reactive hypoglycaemia, whereas foods providing fat or protein
have the reverse effect.
During
exercise, during the first 5-10 minutes of severe exercise, muscle glycogen is
the source of energy, by 40 min, 75-90% of glucose is supplied by blood, mainly
from increased hepatic glucose production (75% from glycogenolysis and 25% from
gluconeogenesis).
4. Reactive (alimentary) or postprandial
hypoglycemia
This occur
after gastric surgery, antibodies to insulin, inborn error of metabolism.
Symptoms occurring 2-4h after food ingestion and last for about 10-20 min. This
is also seen in patients with hereditary fructose intolerance after ingestion
of fructose.
Hypoglycemia in Diabetes Mellitus
Hypoglycemia occur frequently in both type 1 and
2 diabetes. This occurs in diabetic patients using hypoglycemia drugs or
insulin. In many patients with type 1 disease do not experience the neurogenic
warning symptoms for years and are prone to severe hypoglycemia this is called
hypoglycemia unawareness.
HOW TO IDENTIFY THE CAUSE OF HYPOGLYCEMIA
IDENTIFICATION OF CAUSE OF HYPOGLYCEMIA
PLASMA INSULIN AND C-PEPTIDE
Increase in
Insulin and C-peptide in the presence of hypoglycemia indicates islet-cell
tumors, autoimmune insulin secretion, and drug-induced (sulphonylureas,
repaglinide) causing endogenous hyperinsulinaemia.
Decrease in insulin and C-peptide
indicates presence of other secondary conditions like chronic renal failure (as
C-peptide is excreted by kidney), liver disease, alcohol induced, anorexia
nervosa, etc.
Increase in insulin but decrease in
C-peptide indicates administration of exogenous insulin, Insulin anti-receptor
antibodies (IR-A).
PLASMA Β-HYDROXYBUTYRATE
Hypoglycemia
due to hyerinsulinemia shows low ketone bodies. In hypoglycemia due to other
conditions like liver disease, anorexia nervosa, hypopituitarism etc, this ketone
body is raised.
PLASMA PROINSULIN
Normally
only <20% of insulin is released in circulation. In islet cell tumor,
circulating proinsulin is increased.
INSULIN ANTIBODIES
The presence
of insulin antibodies, due to pre-exposure to exogenous insulin may give false
high plasma insulin concentrations. Since C-peptide does not cross-react with
insulin antibodies, its measurement can be used as index of β-cell function.
How Hypoglycemia is investigated ?
A venous
plasma glucose concentration below 50 mg/dl is called hypoglycaemia. The
diagnosis of hypoglycemia necessitates the presence of Whipple’s triad. This
consists of:
1) Symptoms
of hypoglycemia
The classic
signs and symptoms of hypoglycemia are trembling, sweating, nausea, rapid
pulse, lightheadedness, hunger and epigastric discomfort. Neuroglycopenia can
be seen in severe cases (headache, confusion, blurred vision, dizziness, and
seizures).
REGULATORY RESPONSE TO HYPOGLYCEMIA
ACTIVATION OF PARASYMPATHETIC NERVOUS SYSTEM
DEMONSTRAITON OF HYPOGLYCEMIA
PROVOCATION TEST:
Mixed meal test:
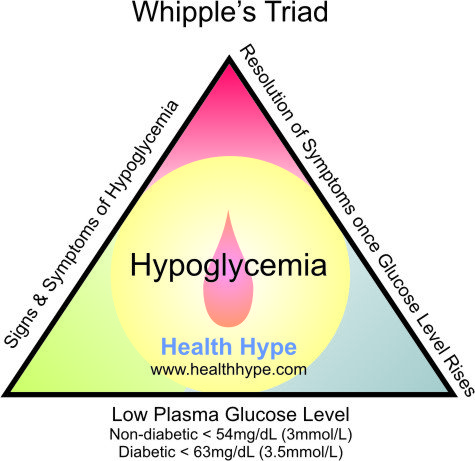 |
| Fig. Whipple's Triad |
2) Low
plasma glucose concentration and
3) Symptoms
relieved by glucose administration.
 |
| Fig. Classical Signs and symptoms of Hypoglycemia |
The most
common cause of hypoglycemia are drugs like propranolol, salicylate, oral
hypoglycemic drugs with long half life like chlorpropamide, insulin secreting
sulfonylureas, glycogen storage disease, alcoholism, septicemia, hepatic
failure, Addison’s disease etc.
REGULATORY RESPONSE TO HYPOGLYCEMIA
In
hypoglycemia, the shortage of glucose in neurons activates hypothalamus, and an
autonomic response to restore and maintain glucose supply initiates which has
many effects like:
ACTIVATION OF SYMPATHETIC NERVOUS SYSTEM
α-ADRENERGIC EFFECTS
- Inhibition of endogenous insulin release
- Increased cerebral blood flow (peripheral vasoconstriction)
β-ADRENERGIC EFFECTS:
- Stimulation of glycogenolysis
- Stimulation of glucagon release (also α cells can sense directly)
- Stimulation of lipolysis
- Inhibition of muscle glucose uptake
- Increased cerebral blood flow (by increasing cardiac output)
CATECHOLAMINE RELEASE FROM ADRENAL MEDULLA
- Potentiates the α and β adrenergic effects
ACTIVATION OF PARASYMPATHETIC NERVOUS SYSTEM
- Stimulates vagus nerve
- Stimulation of gastric acid secretion
- Stimulation of parotid salivary secretion.
There is
hierarchy of response of counter-regulatory hormones; glucagon, epinephrine,
cortisol and GH. Glucagon and epinephrine are rapidly acting hormones whereas
latter two are slow acting and are active at late phase of hypoglycemia. During
fast state the first mechanism is inhibition of endogenous insulin secretion
and followed by release of counter regulatory hormones in hierarchy.
Decreased
endogenous insulin occurs at glucose level 80 mg/dl; increase glucagon,
adrenaline, cortisol and GH secretion at 60 mg/dl and development of
hypoglycaemic symptoms occurs at 50 mg/dl and impairment of cognitive function
at 40 mg/dl.
 INVESTIGATION OF HYPOGLYCEMIA

First is
demonstration of hypoglycemia and second to identify the cause of hypoglycemia.
DEMONSTRAITON OF HYPOGLYCEMIA
MEASUREMENT OF BLOOD GLUCOSE
Measurement
of blood glucose (insulin, C-peptide) during acute neuroglycopenia
(characterized by sweating, anxiety, hunger, palpitation and weakness) is the
best test for the diagnosis of hypoglycemia.
PROVOCATION TEST:
Prolonged fast:
This is the
single most useful test to evaluate suspected hypoglycemia. The aim of this
test is to demonstrate spontaneous hypoglycemia in the presence of
neuroglycopenic symptoms during prolonged fasting for 48 h, and that the
symptoms resolve on glucose administration.
During the
fasting period blood glucose, insulin, C-peptide is measured at every 4-6
hours. But as glucose level falls below 50 mg/dl frequent sample must be taken.
About 95% of patient will develop hypoglycaemia within 48 h. Measurement of
β-hydroxybutyrate and its raising presence indicates suppression of insulin release
and fast can be terminated by giving glucose when FBS becomes <45 mg/dL and
patient exhibit signs or symptoms of hypoglycemia.
Mixed meal test:
This is used
to investigate patients who experience postprandial symptoms, for the
possibility of reactive hypoglycemia. Meal is ingested and plasma glucose
measured every 30 min for 6h and at any time during symptomatic phase. Patients
developing neuroglycopenia symptoms during hypoglycemia, but not at other times
during the test, are considered to have postprandial hypoglycemia.
COMPLICATIONS OF DIABETES
DIABETIC RENAL DISEASE (DIABETIC NEPHROPATHY)
It is most
common in type 1 diabetes. Some 20-30% of patients with type 1 diabetes will
develop renal disease (15-25 years after diagnosis). It is less prevalent in
type 2 diabetes (only 10-20% lifetime risk).
HYPERFILTRATION AND MICROALBUMINURIA
The earlier
symptoms of diabetes includes hyperfiltration (with urine albumin excretion,
UAE, <30mg/24 hour or 20µg/min) followed by progression through
microalbuminuria to proteinuria (UAE>300 mg/24 h or 200µg/min). After this
GFR falls and progress to ESRF. The first and best opportunity to detect the
disease clinically is at the stage of microalbuminuria. Dip-stick testing or
urine is not usually positive at such concentration of albumin and detection
relies on either 24 h quantitation or more conveniently the use of
albumin/creatinine ratio (normal <2.5 mg/mmol in men and <3.5 mg/mmol in
women) on at least two out of 3 separate urine specimens over a 3-6 month
period can be done. Due to day to day variation of UAE rates 2 of 3 samples
should be positive for the diagnosis. Microalbuminuria is not just a risk
factor of nephropathy but an independent risk factor for CAD (one of the most
potent risk factors known), being also associated with dyslipidaemia,
hypertension, endothelial dysfunction and diabetic retinopathy.
TYPE 4 RENAL TUBULAR ACIDOSIS
Hyporeninaemic
hypoaldosteronism may be a manifestation of diabetic nephropathy. It presents
with hyperchloraemic, hyperkalaemic metabolic acidosis. Failure of renin to
rise in response to posture or sodium restriction suggest an interstitial
(juxtaglomerular) defect. The failure of aldosterone release to be stimulated
directly by resulting hyperkalaemia suggest the possibility of dysfunction of
adrenal zona glomerulosa.
CHARCOT FOOT
It is a specific foot deformity occurring due to
neuropathy and if untreated leads to bone collapse of the foot causing outward
bowing. OTHER DIABETIC EMERGENCIES: HYPEROSMOLAR HYPERGLYCAEMIC STATES AND ALCOHOLIC KETOACIDOSIS
HYPEROSMOLAR HYPERGLYCAEMIC STATES
Initially
called hyperosmolar non-ketotic (HONK) hyperglycaemia. The dominant clinical
feature is dehydration. It mainly occurs in older subjects with type 2 diabetes
mellitus. The cycle of hyperglycaemia, dehydration (occurring due to vomiting,
polyuria, glycosuria osmotically takes more water in urine) and increased
counter regulatory hormones (induced by acidosis and dehydration and
hyperglycemia) is same in ketoacidosis but is more severe. There is
hypernatremia caused by renal sodium resorption in response to hypovolaemia, together
with osmotic diuresis causing persistent free water loss.
Non-ketotic
hyperosmolar state usually occurs during marginal insulin deficiency, and their
insulinaemia has sufficient antilipolytic effect to prevent the lipolytic and
ketotic problems seen in ketoacidosis. There is decrease in anion gap <20
mmol/L and bicarbonate is normal and pH >7.30. There is hypernatraemia and
more severe water loss 18 L in typical adult.
ALCOHOLIC KETOACIDOSIS
During
alcoholism and resulting poor diet is association with vomiting, this cause
ketoacidosis and low, normal or elevated blood glucose. Ketosis is caused by
lack of insulin action which results in mobilization of NEFAs and their
conversion to ketone bodies as alternative fuel. This is potentiated by
counter-regulatory hormones like glucagon, cortisol and catecholamines secreted
in response both to hypoglycaemia and extracellular fluid volume contraction.
In addition, alcohol metabolism depletes cellular NAD+ which by
restricting pyruvate formation from lactate, causes accumulation of lactate and
depletion of pyruvate, a gluconeogenic substrate. As is the case in DKA,
alteration in mitochondrial redox state favors beta hydroxybutyrate over
acetoacetate production. A complex acid-base disorder ensues from the combined
effects of ketosis causing metabolic acidosis, and a combination of
extracellular fluid contraction and vomiting causing metabolic alkalosis.
DIABETIC EMERGENCIES: DIABETIC KETOACIDOSIS (DKA)
DIABETIC KETOACIDOSIS
Approximately
30% of patient with type 1 diabetes present with ketoacidosis with clinical
features of dehydration, shock, vomiting, abdominal pain, acidosis and cerebral
impairment. There are four mechanisms of ketoacidosis: insulin deficiency,
counter-regulatory hormone excess, fasting and dehydration. The most important
is insulin deficiency. Hyperglycaemia and excess lipolysis cause dehydration
and high circulating concentrations of NEFAs. Due to this hyperglycemia,
ketosis and dehydration there is increase release in of counter-regulatory
hormones which induce further hyperglycemia and lipolysis along with insulin
resistance.
Biochemical
features of ketoacidosis include hyperglycaemia, ketosis, metabolic acidosis
and uremia. The characteristic ketosis is the consequence of increased
lipolysis and decreased fat synthesis. Excess acetyl-CoA derived from beta
oxidation of fatty acid is converted to the ketone bodies, acetoacetate and
beta hydroxybutyrate with some acetone. Plasma beta hydroxybutyrate are 3 times
more than acetoacetate.
Hyponatremia
results from osmotic movement of intracellular water to interstitial and
intravascular compartments drawn towards the hyperglycaemic plasma. Lipaemic
serum (due to hypertriglyceridaemia) also gives false low sodium value.
Whole body
potassium depletion is universal in DKA. Administration of insulin can also
cause hypokalemia as insulin cause intracellular flux of potassium.
Cerebral
oedema is one of the most feared complications of ketoacidosis mostly occurring
in children.
What is Somogyi effect and Dawn phenomenon ?
SOMOGYI EFFECT AND THE DAWN PHENOMENON
A special
form of rebound from hypoglycaemia is the somogyi phenomenon, in which
nocturnal hypoglycaemia occurs. There is awakening with malaise, headache and
bedclothes damp from sweating are suggestive. Again due to falling blood
glucose counter regulatory hormone are released and again hyperglycemia occurs.
The rebound from the nocturnal hypoglycaemia results in patient waking with
blood glucose concentration higher then desirable, causing the temptation to
take at least as much (or even more) insulin the next night.
Non-diabetic
subjects show circadian changes in blood glucose. The most marked such
circadian effect is the dawn phenomenon which typically occurs between 4 and 7h
and is an increase in plasma glucose and decrease in insulin sensitivity due to
increased secretion of counter-regulatory hormones at that time. During this
period people with diabetes usually experience modest rise (20-40 mg/dl) in
blood glucose without ingestion of food.
Brittle diabetes
This is a
condition of episodes of hypo or hyperglycaemia whatever their cause. Causes
include psychological abnormalities such as eating disorders, personality
disorders, etc. Other causes are inappropriate education, unsuitable insulin
regimen, intercurrent illness such as thyroid disease, Addison’s disease, SLE
(antibodies to insulin or its receptor), etc.
CONSEQUENCES OF DIABETES
 |
| Fig. Causes of Type 2 Diabetes |
The risk of
hypoglycaemia is the main limitation to achievement of good glycaemic control
in diabetes. In normal subjects the
first response to falling blood glucose is reduction in insulin secretion
occurring at blood glucose level below 80 mg/dl. This is lacking in subjects
with type 1 diabetes or type 2 diabetes. Glucagon forms the next layer of
defence, stimulating hepatic glycogenolysis and gluconeogenesis. However, most
patients with type 1 and 2 are chronically hyperglucagonaemica and cannot
respond to hypoglycaemia in this way. The last level of defence against acute
hypoglycaemia is activation of the sympathetico-adrenal system, which normally
occurs when blood glucose falls to below 55 mg/dl. This increases lipolysis and
circulating NEFA (Non-esterified fatty acid) production and utilization, and mobilization of substrates for
gluconeogenesis further inhibits insulin secretion and promotes glucagon
release. Activation of the sympatheticopadrenal system gives first-clear
symptoms of hypoglycaemia which is due to autonomic activation and
Neuroglycopenia.
 |
| Fig. Consequences of Diabetes |
CLINICAL MANAGEMENT OF DIABETES MELLITUS
DIET


PHARMACOLOGICAL MANAGEMENT
ASPIRIN
LIPID LOWERING AGENT
HYPERTENSION
ACE INHIBITORS AND ANGIOTENSIN II RECEPTOR ANTAGONIST
HYPOGLYCAEMIC TREATMENT IN DIABETES
METFORMIN
SULPHONYLUREAS (AND RELATED INSULIN SECRETOGOGUES)
PPAR- γ ANALOGUES:

All patients with type 1 diabetes are treated with exogenous insulin. Both long-acting or basal and short-acting or bolus insulin are used. Rapid acting insulin has rapid onset of action (<15 min), permitting injection immediately before or just after eating and has 3-5 hours of action which reduces the risk of hypoglycemia before next meal. It has sharper peak response resembling first-phase insulin release in normal persons. Some rapid acting insulins are Insulin aspart, it is homologous to human insulin with exception of single substitution of aspartate for proline in position B28. In Insulin lispro proline and lysine at B28 and 29 respectively are reversed.

Long acting insulins e.g. glargine and detemir, has 24h duration of action with minimum peak action. The regimen consists of twice daily insulin mixture of longer and shorter acting insulins in ratio typically between 75/25 and 60/40. Another compromise of single dose of long-acting insulin at night with doses of short-acting insulin immediately before meals during the day (basal-bolus regimen).
Dietary
modifications includes,
- Low intake of simple carbohydrates with increase uptake in complex carbohydrates which can be slowly absorbed and have high glycemic index. Carbohydrates (complex carbohydrates) should provide approximately 55% of total energy
- Protein should provide 15% of total energy.
- There should be no more than 30% energy intake from fat, with increase in uptake of unsaturated fatty and <7% saturated fatty acid uptake.
- Sodium intake should not exceed 6g/day and plentiful fruits preferably less sugar containing and vegetables (five portions a day).
- A total daily dietary fiber intake of 40g is ideal.


EXERCISE
Regular
low-intensity exercise like brisk walking, swimming or cycling for 30 min 3-5
times/week. This improves glucose disposal (by increasing GLUT4 in skeletal
muscle), prevents progression from IGT to type 2 diabetes (by about 50%),
increases basal metabolic rate (BMR) and reduces cardiovascular events.
SMOKING CESSATION

PHARMACOLOGICAL MANAGEMENT
ASPIRIN
Aspirin (or
clopidogrel if aspirin is contraindicated) should be given for all men and
women with type 1 or 2 diabetes over the age of 40, and those over 30 who have
additional risk factors (e.g. family history, hypertension, smoking,
dyslipidaemia, albuminuria). In lower age aspirin is avoided due to risk of
Reye’s syndrome.
LIPID LOWERING AGENT
Consumption
of saturated fat, cholesterol and transunsaturated fat, inadequate exercise are
the primary cause of dyslipidaemia whereas alcohol excess, hypothyroidism,
liver disease are the secondary cause of dyslipidaemia.
Metformin,
pioglitazone and insulin can be used as lipid lowering agent; they either
increase insulin action or reduce the flux of NEFA to liver (pioglitazone).
HMG-CoA
reductase inhibitors, statins: They lower LDL-C. The ADA currently recommends
an LDL-C target of 2.6 mmol/L in all patients over 40 years with diabetes as
primary prevention, and in younger people with risk factors. ADA also
recommends targets for tirglycerides of 1.7 mmol/L and HDL above 1.1 mmol/L.
HYPERTENSION
The ADA
adopted the target of 130/80 to start treatment of hypertension in diabetes.
ACE inhibitors of angiotensin II blockers are first line agents in diabetes.
Amlodipine is the second line of drug in combination with ACE inhibitor
Angiotensin receptor blocker, ARB.
ACE INHIBITORS AND ANGIOTENSIN II RECEPTOR ANTAGONIST
Angiotensin
II (ATII) increases hepatic glucose production and decreases insulin
sensitivity. Use of these agents increases insulin sensitivity. These are
indicted for subjects with diabetes and hypertension, microalbuminuria,
proteinuria, mild to moderate renal impairment, diabetic retinopathy, ischaemic
heart disease and stroke.
HYPOGLYCAEMIC TREATMENT IN DIABETES
METFORMIN
This
improves glycaemic control without weight gain. This is the first choice in
treating type 2 diabetes especially overweight subjects. It reduces hepatic
glucose output, improves peripheral glucose uptake and utilization in
insulin-sensitive tissues (muscle, adipose tissue tissue) and reduces
intestinal glucose transport. In type 2 diabetes, metformin can be used as
monotherapy, or combined with insulin or with sulphonylureas and/or
thiazolidinediones. In type 1 it is used with insulin for obese adults.
The main
side effect of the use of biguanides (of which metformin is one) is lactic
acidosis presented with lethargy nausea, vomiting, abdominal pain.
Biochemical
features of lactic acidosis are elevated anion gap metabolic acidosis with high
blood lactate.
SULPHONYLUREAS (AND RELATED INSULIN SECRETOGOGUES)
These drugs
acts as insulin secretogogues, reducing glucose by augmenting the firs-phase
insulin release.
In beta
cells the APT dependent potassium channel has regulator domain of sulphonylurea
receptor 1 (SUR-1). Sulphonylurea binds to this site and cause closure of KATP
channels depolarizing the membrane, causing rapid influx of calcium ions via
voltage dependent calcium channels. The resultant increase in free ionized
calcium triggers cytoskeletal trafficking of secretory granules to plasma
membrane and release of insulin by exocytosis. Other drugs like Glibenclamide,
meglitinides nateglinide acts through same mechanism binding to SUR-1.
These drugs
in contraindicated in type 1 diabetes, pregnancy, lactation and hepatic and
renal insufficiency.
PPAR- γ ANALOGUES:
E.g.
Thiazolidinediones; these are ligands for orphan nuclear peroxisome
proliferator activator receptor family (PPARα, PPARγ, and PPARδ). These
receptors are expressed in tissue that metabolizes fatty acids extensively like
liver, kidneys, heart and muscle. They also increases HDL-C apolipoproteins,
apo A-I, II decrease hepatic C-III production thus lowering TG vial reduced
formation of VLDL. The nuclear PPAR receptors are endogenously activated by
fatty acids and fatty acid-derived eicosanoids and the action of fibrate group
of lipid lowering agents is mediated via PPARα receptors. Activation of PPARs
leads to formation of heterodimers with the retinoid X receptor (RXR), bound to
its own endogenous ligand, retinoic acid. These PPAR-RXR dimers bind to their
response element (PPREs) modulating transcription of >40 target genes.
The insulin
sensitizing effect of PPARγ agonist is due to fatty acid steal mechanism (i.e.
changes in NEFA metabolism benefits for other tissues). These increases free
fatty acid uptake in adipose tissue (by about 60%) and also increase fatty acid
oxidation in liver, heart, kidneys and skeletal muscle. So, hepatic uptake of
NEFA is reduced by 40%, rendering liver more insulin sensitive and giving these
agents a potential role in treatment of hepatic steatosis. In adipose tissue
they cause adipocyte differentiation and fat distribution from central to
subcutaneous depots further reducing hepatic uptake of NEFA.
Thiazolidinediones
are used in combination with both metformin and sulphonylurea as triple
therapy. Other PPAR analogues are pioglitazone, rosiglitazones.
INSULINS
In type 1
diabetes beta cell function, that falls to 10% of normal at disease
presentation, doubles after initiation of insulin therapy and metabolic
stabilization (honeymoon effect). This may be due to amelioration of
glucotoxicity or lipotoxicity on the reduced numbers of and metabolically
stressed beta cells.
All patients with type 1 diabetes are treated with exogenous insulin. Both long-acting or basal and short-acting or bolus insulin are used. Rapid acting insulin has rapid onset of action (<15 min), permitting injection immediately before or just after eating and has 3-5 hours of action which reduces the risk of hypoglycemia before next meal. It has sharper peak response resembling first-phase insulin release in normal persons. Some rapid acting insulins are Insulin aspart, it is homologous to human insulin with exception of single substitution of aspartate for proline in position B28. In Insulin lispro proline and lysine at B28 and 29 respectively are reversed.

Long acting insulins e.g. glargine and detemir, has 24h duration of action with minimum peak action. The regimen consists of twice daily insulin mixture of longer and shorter acting insulins in ratio typically between 75/25 and 60/40. Another compromise of single dose of long-acting insulin at night with doses of short-acting insulin immediately before meals during the day (basal-bolus regimen).
In type 2
diabetes patients require insulin treatment after a median of 7 years from
diagnosis. Insulin treatment in overweight or obese has risk of further weight
gain, which increase the need for escalating insulin does and spiraling
obesity. Reasons for weight gain after starting insulin in type 2 diabetes
include a reduction in energy wastage through glycosuria, anabolic effects of
insulin, reduction in attention to diet and exercise in presence of an highly
effective means of glycemic control and increased eating because of the need to
avoid or treat hypoglycemia on insulin regimens. These patients do not require
exogenous insulin throughout 24 hours. Most patients with type 2 diabetes
especially those who are overweight, should remain on metformin when insulin is
instituted in whatever form.
URINARY ALBUMIN EXCRETION (UAE) : INTRODUCTION AND ITS IMPLICATIONS
Patients with diabetes mellitus are at high risk of suffering renal damage. Diabetes is the most common cause of end -stage renal disease (ESRD). Although nephropathy is less common in patients with type 2 diabetes, approximately 60% of all cases of diabetic nephropathy occur in these patients because of the higher incidence of this form of diabetes. Early detection of diabetic nephropathy relies on tests of urinary excretion of albumin. Persistent proteinuria detectable by routine screening tests (equivalent to a urinary albumin excretion [UAE] rate greater than or equal to 30 mg/d) indicates overt diabetic nephropathy. Once diabetic nephropathy occurs, renal function deteriorates rapidly and renal insufficiency evolves. Treatment at this stage can retard the rate of progression but not stop or reverse the renal damage. Preceding this stage is a period of increased UAE not detected by routine methods. This range of 20 to 200 μg/min (or 30 to 300mg/24hr or albumin/creatinine ratio of 30-300 μg/mg) of increased UAE defines microalbuminuria. Note that it is not defined in terms of urinary albumin concentration, although the albumin: creatinine ratio can be used as a substitute for albumin measurements in a time collection of urine. The term microalbuminuria implies a small version of the albumin molecule rather than an excretion rate of albumin greater than normal but less than that detectable by routine methods. Clinical proteinuria or microalbuminuria is established with an albumin-creatinine ratio of ≥300 μg/mg or protein excretion ≥300 mg/day.
The presence of increased UAE denotes an increase in the transcapillary escape rate of albumin and is therefore a marker of microvascular disease. Persistent UAE greater than 30 mg/d represents a twentyfold greater risk for the development of clinically overt renal disease in patients with type 1 and type 2 diabetes. Prospective studies have demonstrated that increased UAE precedes and is highly predictive of diabetic nephropathy, end-stage renal disease, cardiovascular mortality, and total mortality in patients with diabetes mellitus. In addition increase UAE identifies a group of nondiabetic subject at increased risk of coronary artery disease.
UAE is increased by physiological factors (e.g., exercise, posture, and diuresis) and the method of urine collection must be standardized. Samples should not be collected after exertion, in the presence of urinary tract infection, during acute illness, immediately after surgery, or after an acute fluid load. All the following urine samples are currently acceptable:
(1) 24-hour collection;
(2) overnight (8 to 12 hours, timed) collection;
(3) 1- to 2-hour timed collection (in laboratory or Clinic); or
(4) first morning sample for simultaneous albumin and creatinine measurement.
Only results for timed specimens can be reported as mg albumin excreted per hour, but the albumin: creatinine ratio is more practical and convenient for the patient and is the recommended method. A first morning void sample is best because it has a lower within-person variation for the albumin: creatinine ratio than a random urine sample. At least three separate specimens, collected on different days, should be assayed because of the high intraindividual variation diurnal variation (50% to 100% higher during the day). Urine should be stored at 40C after collection. Alternatively, 2 mL of 50 gm/L sodium azide can be added per 500 mL of urine, but preservatives are not recommended for some assays. Bacterial contamination and glucose have no effect. Specimens are stable for 2 weeks at 4 'C and for at least 5 months at -800C. Albumin concentration decreased by 0.27% at -200C. Freezing samples has been reported to decrease albumin, but mixing immediately before assay eliminates this effect.
The test strips most of which are optimized to read positive at predetermined albumin concentration have been recommended for screening programs. Test strips contains bromophenol blue in alkaline matrix to detect albumin concentrations exceeding 40 mg/L. Other test strips include antialbumin IgG complexed to galactosidase. The albumin in the urine binds to antibody enzyme conjugate in the test strip. Excess conjugate is retained in a separate zone containing immobilized albumin and only albumin bound to the antibody-enzyme immunocomplex diffuses to the reaction zone. Here it reacts with a buffered substrate (chlororphenol red galactoside) to produce a red color when the beta galactosidase hydrolyzes galactose.
For quantitation different RIA, ELISA radial immunodiffusion and immunoturbidimetry are available.
The ADA recommends initial UAE measurement in type 1 diabetes patients who have had diabetes more than or equal to 5 years and in all type 2 diabetic patients. Because of the difficulty in dating the onset of type 2 diabetes, screening should commence at diagnosis. Analysis should be performed annually in all patients who have a negative screening results. If screening result is positive UAE should be evaluated by quantitative assay. Diagnosis requires the demonstration of increased UAE in at least two of 3 tests measured within 6 month period.
 |
| (Source: Tietz Clinical Chemistry, 4th Edition) |
TEST FOR INSULIN RESISTANCE
Subjects
requiring large amount of insulin to maintain euglycaemia e.g. >150 units or
1.5 units/kg body weight/day, insulin resistance may be postulated. For this
insulin is administered intravenously and subcutaneously and the level of glucose
and insulin in plasma is measured. Normal fasting insulin concentration are up
to 20 mU/L. Hyperinsulinaemic clamp is the reference measure of insulin
resistance. In euglycaemic variant of the test, insulin is infused into a
peripheral vein so as to raise the plasma insulin concentration to a target
range around 60 mU/L.
 The plasma glucose concentration is measured every 5-10
min and glucose is infused peripherally to maintain glucose concentraions
within the desired range. When a steady state has been reached (usually 90-120
min), the rate of exogenous glucose infusion needed to maintain the glucose
concentration is an index of the glucose clearance rate and of the subject’s
insulin sensitivity.
The plasma glucose concentration is measured every 5-10
min and glucose is infused peripherally to maintain glucose concentraions
within the desired range. When a steady state has been reached (usually 90-120
min), the rate of exogenous glucose infusion needed to maintain the glucose
concentration is an index of the glucose clearance rate and of the subject’s
insulin sensitivity.

Glucose
transporter function can be assayed by incubating cells of interest (e.g.
leukocytes, monocytes, adipocytes) with a non-metabolizable glucose analog such
as 2-deoxyglucose. The cellular content of the glucose analogue after a given
time provides a measure of glucose transporter function.
MEASUREMENT OF β- CELL FUNCTION
Measurement
of plasma C-peptide concentration can be done. Elevated fasting plasma
proinsulin indicates subjects with abnormal beta cell function, even if glucose
tolerance is normal.
MEASUREMENT OF β- CELL FUNCTION
Measurement
of plasma C-peptide concentration can be done. Elevated fasting plasma
proinsulin indicates subjects with abnormal beta cell function, even if glucose
tolerance is normal. ADVANCED GLYCATION END PRODUCTS: AN INTRODUCTION
The
molecular mechanism by which hyperglycemia produces toxic effect is unknown,
but glycation of tissue proteins may be important. Nonenzymatic attachment of
glucose to long lived proteins like collagen or DNA, produces stable Amadori
early Glycated products. These undergo a series of additional rearrangements
dehydration and fragmentation reactions, resulting in stable advanced glycation
end products (AGE). The amounts of these products do not return to normal when
hyperglycemia is corrected and they accumulate continuously over the lifespan
of the protein. Hyperglycemia accelerates the formation of protein-bound AGE,
and patients with diabetes mellitus thus have more AGE than healthy subjects.
Through effects on the functional properties of protein and extracellular
matrix, AGE may contribute to the microvascular and macrovascular complications
of diabetes mellitus. Moreover an inhibitor of AGE formation, aminoguanidine
has been shown to prevent several complications of diabetes in animal model.
In healthy
people Hb-AGE accounts for 0.4% of circulating Hb, with significantly higher in
diabetes mellitus. After acute change in glycemia, Hb-AGE level changes, but
the rate of alteration is 23% slower than that of HbA1c. Thus Hb-AGE
provides a measure of diabetic control longer than that indicated by GHb,
reflecting blood glucose concentration over a greater proportion of life of red
blood cells.
Fructosamine and it's implications
FRUCTOSAMINE
Fructosamine
is a ketoamine product of protein glycation formed when glucose bound to
variety of proteins by aldimine linkage undergoes an Amadori rearrangement. The
major component of fructosamine in plasma is Glycated albumin. Fructosamine is
easily measured (using nitroblue tetrazolium assay); its concentration reflects
control over the preceding 15-20 days. When the patient has abnormal
hemoglobins, or during pregnancy alternative tests should be used. Glycated
albumin and Glycated fibrinogen are proposed for such conditions. Albumin has
half life of approximately 20 days, so fraction that is Glycated reflects
glycaemic control for the preceding 1-2 weeks.
 |
| (Source: Tietz Clinical Chemistry, 4th Edition) |
Fructosamine
is the generic name for plasma protein ketoamine. There is interaction of
glucose with the ε-amino group on lysine residue of albumin. Because all
Glycated serum proteins are fuctosamines and albumin is the most abundant serum
protein, measurement of fructosamine is thought to be largely a measure of
Glycated albumin. As fructosamine determination monitors short term glycemic
changes different from GHb, it may have a role in conjunction with GHb rather
than instead of it. In addition fructosamine may be useful in patients with
hemoglobin variants such as HbS or HbC that are associated with decreased
erythrocyte lifespan where GHb is of little value. Fructosamine values are
highly affected and not recommended in conditions that affect protein turnover
like liver cirrhosis, nephrotic syndrome or dysproteinemias, inflammatory
conditions. It is generally accepted that the test should not be performed when
serum albumin is less than 30g/L.
Methods for
measuring Glycated proteins include affinity chromatography using immobilized
phenylboronic acid, HPLC of Glycated lysine residue after hydrolysis of
Glycated proteins, photometric procedure in which mild acid hydrolysis releases
5-hydroxymethylfurfural- proteins are precipitated with TCA and the supernatant
is reacted with 2-thiobarbituric acid; and other procedures using
phenylhydrazine and furosine. Another
method is under alkaline conditions which results in fructosamine undergoing an
Amadori rearrangement and the resultant compounds having reducing activity that
can be differentiated from other reducing substances. In the presence of
carbonate buffer, fructosamine rearranges to the eneaminol form, which reduces
NBT to a formazan. The absorbance at 530 nm is measured at two time points and
the absorbance change is proportional to the fructosamine concentration.
TEST FOR RECENT GLYCAEMIC CONTROL: HbA1c measurement
MEASUREMENT OF GLYCATED HEMOGLOBIN
Glycation is
the non enzymatic addition of sugar residue to amino groups of proteins. In
adults HbA constitute the major fraction (97%) also has other subforms namely A1a,
A1b, A1c which are collectively called HbA1,
fast hemoglobins, glycohemoglobins or Glycated hemoglobins. HbA1c is
formed by the condensation of glucose with N-terminal valine residue of each β-chain
of HbA to form an unstable Schiff base (aldimine, pre-HbA1c). The
Schiff base may either dissociate or undergo an Amadori rearrangement to form a
stable ketoamine, HbA1c. HbA1a1, 1a2 which make up HbA1a
have fructose-1, 6-diphosphate and glucose-6-phosphate, respectively attached
to amino terminal of the β-chain. Other are HbA1b has pyruvate
attached to N-terminal of beta chain. HbA1c
is the major fraction constituting approximately 80% of HbA1.
Glycation
may also occur at sites other than the end of beta chain, such as lysine
residue or the alpha chain. These GHbs referred to as Glycated HbA0
or total Glycated Hb. These are measured by boronate affinity chromatography.
 |
| (Source: Tietz Clinical Chemistry, 4th Edition) |
Formation of
GHb is essentially irreversible and the concentration in the blood depends on
both the lifespan of the red blood cell (average 120 days) and the blood
glucose concentration. Since erythrocyte is free permeable to glucose. Because
the rate of formation of GHb is directly proportional to the concentration of
glucose in the blood, the GHb concentration represents the integrated values
for glucose over the preceding 6 to 8 weeks. This provides an additional
criterion for assessing glucose control because GHb values are free of day to
day glucose fluctuations and are unaffected by recent exercise or food
ingestion.
The
interpretation of GHb depends on the red blood cells having a normal lifespan.
Patients with hemolytic disease or other conditions with shortened red blood
cells survival exhibit a substantial reduction in GHb. Similarly individuals
with recent significant blood loss have false low values owing to higher
fraction of young erythrocytes. High GHb concentrations have been reported in
iron deficiency anemia, probably because of high proportion of old
erythrocytes. Presence of other hemoglobinopathies can alter results. Presence
of carbamylated Hb which is formed by attachment of urea and is present in
large amount in renal failure and common in diabetic patients, also produce
altered results.
GHb has been
established as an index of long term blood glucose concentration and as a
measure of the risk for the development of complications in patients with
diabetes mellitus. There is direct relationship between blood glucose
concentration (assessed by HbA1c) and the risk of complications. The
absolute risks of retinopathy and nephropathy were directly proportional to the
mean HbA1c. Studies have shown reduction in HbA1c level
will significantly reduce the risk of microvascular complications and
retinopathy and nephropathy and cardiovascular disease. ADA recommends that a
primary treatment goal in adults with diabetes should be near normal glycemia
with HbA1c <7%. HbA1c of 7% (of total HbA) corresponds with mean
plasma glucose of approximately 170 mg/dl, and each 1% increase with a 36 mg/dl
increase in mean plasma glucose concentrations.
There are
more than 30 different methods for determination of GHbs. These methods
separate hemoglobin from GHb using technique based on charge differences
(ion-exchange chromatography, HPLC, electrophoresis, IEF), structural
differences (affinity chromatography and immunoassay), or chemical analysis (photometry
and spectrophotometry). The result in all is expressed as percentage of total
Hb.
Ion exchange
chromatography separates Hb variants on the basis of charge. The cation
exchange resin (negatively charged) packed in disposable minicolumn has an affinity
for Hb, which is positively charged. The patient’s sample is hemolyzed and an
aliquot of the hemolysate is applied to the column. A buffer is applied and the
eluent collected. Here GHb is less positively charged than other so will elute
first than other. The eluted GHb (A1a, 1b and 1c, collectively A1) are measured
in spectrophotometer. Other Hbs are also measured after subsequent elution and
the HbA1 is expressed as percentage of total.
HPLC can be
used for separation and quantitation of HbA1c and other fractions. HPLC
employs, cation exchange chromatography.
Agar gel
electrophoresis on whole blood hemolysates at pH 6.3 provides good resolution
of HbA and HbA1. The gel contains negatively charged moieties that
interacts with the hemoglobin. After 25 to 35 minutes, the GHb separates on the
cathodic side of HbA. Quantification is done by scanning densitometry at 415
nm.
The
hemoglobin variant separate on IEF on the basis of their migration in gel
containing pH gradient on acrylamide gel slabs.
Immunoassay
with the principle of immunoinhibition are used like ELISA where antibodies are
raised and used to inhibit other fraction in one hand and capture and detection
antibodies are used to determine HbA1c.
Affinity gel
columns are used to separate GHb, which binds to the column, from the
nonglycated fraction. M-Aminophenylboronic acid is immobilized by cross linking
to beaded agarose or another matrix (e.g., glass fiber). The boronic acid reacts
the cis-diol groups of glucose bound to Hb to form a reversible five member
ring complex thus selectively holding the GHb on the column. The nonglycated Hb
does not bind. Sorbitol is then added to elute the GHb. Absorbance of the bound
and nonbound fractions measured at 415 nm is used to calculate the percentage
of GHb. Nonglycated Hb does not bind and is removed In a wash step. The
sorbitol competes for boronate binding sites.
 |
| (Source: Tietz Clinical Chemistry, 4th Edition) |
For borate
affinity assay, packed blood cells are mixed with hemolysate reagent that
contain borate buffer. Glycated Hb is assayed from this hemolysate.
Subscribe to:
Posts (Atom)
